
To solve inequalities using the graphic calculator, we can plot the equations on both sides of the inequality sign into the graphic calculator.
Once this is done, look at the inequality to determine the region that we are interested in. The portion that is greater should have a larger y value, while the portion that is smaller should have a smaller x value. Give the range of values of x that satisfies this inequality.
Example: Solve this inequality x³ + x² > 1 + x
We have ln x on the left hand side of the inequality sign, and 1 +x on the right hand side of the inequality sign. We’ll sketch y = x³ + x² and y = 1 +x on the graphic calculator.
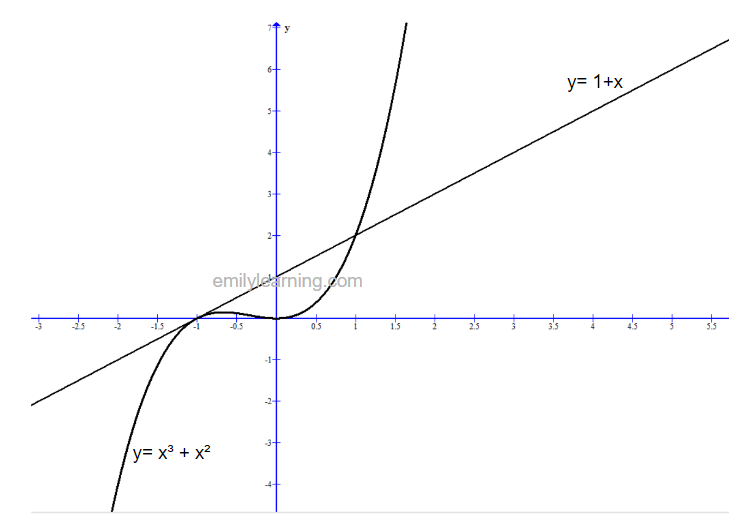
Since we are interested in x³ + x² being more than 1 +x, then x³ + x² should be above 1+x in the graph above (so that it has a larger y value).
The region boxed up in “red” has x³ + x² being more than 1+x. Looking at the x values, we know that this occurs when x> 1.
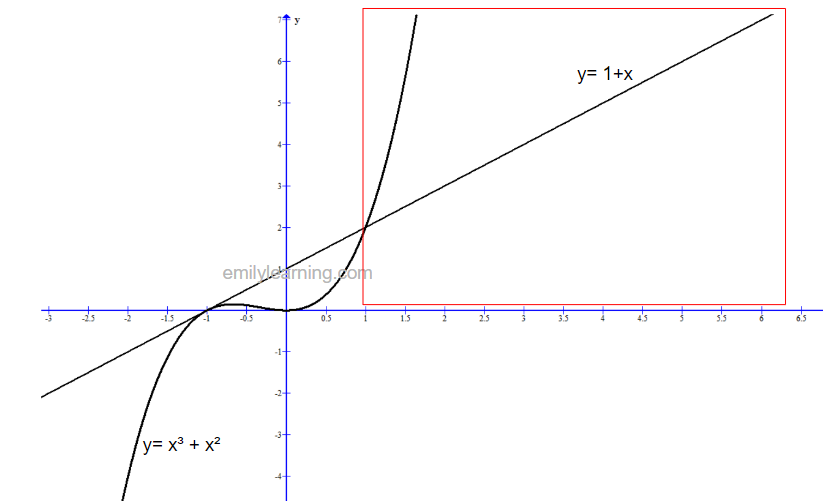
Hence, the solution for x³ + x² > 1 + x is x > 1.
Learn H2 A Level Math Inequalities
Here are the complete notes for solving inequalities for H2 Math:
- Solving inequalities using the graphic calculator
- Solving inequalities involving polynomials
- Solving inequalities involving polynomial fractions
- Quadratic functions that are always positive or negative
- Solving inequalities with functions that are always positive or negative
- Modulus Functions
- Solving inequalities involving modulus functions 1
- Solving inequalities involving modulus functions 2
- Solving inequalities involving modulus functions 3
All the notes for H2 A Level Math
Go here to find all the notes and resources for H2 A level Math.