

Regression and Correlation questions are found in paper 2, section B (Statistics section) of the H2 A Level Math exam. In this post, you will find the worked solutions for past A Level questions on Regression and Correlation.
A list of past questions from each statistics topic can be found here.
A quick summary of formulae in each statistics topics can be found here.
Past A Level Regression and Correlation Questions
These are the past A Level Regression and Correlation questions for the new syllabus (syllabus 9758) which started from 2017.
Click on the link to go straight to the worked solutions for each question.
Hypothesis Testing Question: 2017 Paper 2 Question 8
(a)
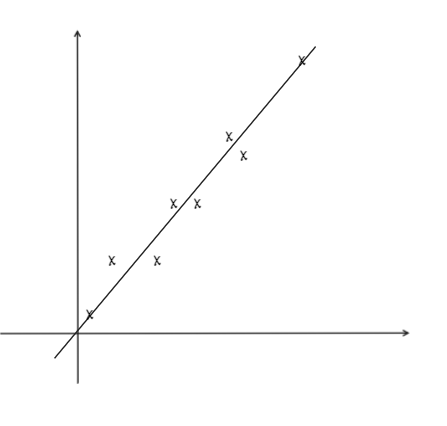
when r = -1
when r= 0
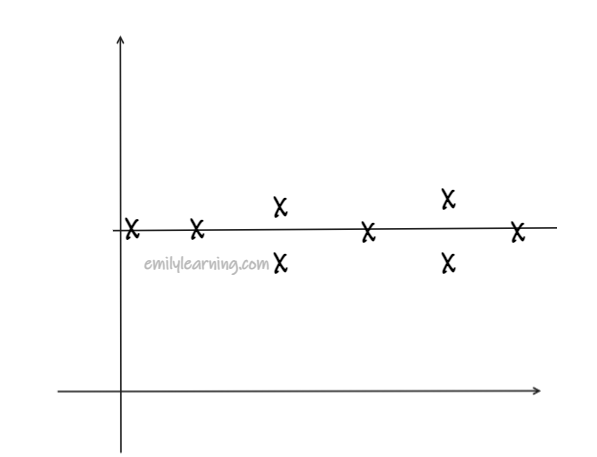
0.5<r<0.9
(bi)
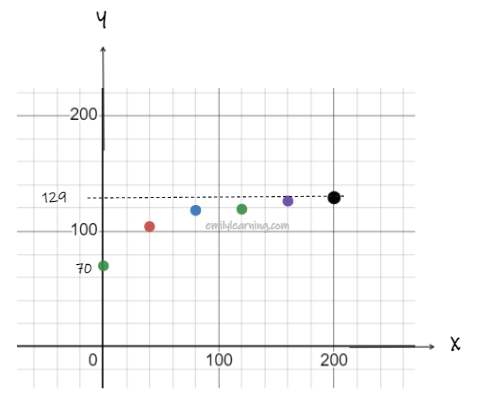
From scatter plot, it can be seen that for positive values of x from 0 to 200, gradient is positive, and decreasing.
Given a and b are positive,
graph A will give a curve with increasing gradient for x from 0 to 200.
graph B will give a curve with a negative gradient ( decreasing y values with increasing x). However, this graph is undefined at x=0, but the scatter plot shows that when x = 0, y is defined (i.e. y= 70).
graph C will give a curve with positive gradient, that is decreasing. However, as this is a ln graph, it will have undefined values at x = 0. The scatter plot shows that when x = 0, y is defined (i.e. y= 70).
graph D will give a curve with positive gradient that is decreasing for x from 0 to 200. Also, the equation is defined at x = 0.
Hence, graph D is the most accurate model.
(ii) Using the graphic calculator, for y = a√x + b,
a = 4.1821 = 4.18 ( 3 s.f.)
b= 74.048 = 74.0 ( 3 s.f.)
r= 0.98085 = 0.981 ( 3 s.f.)
(iii) r = 0.981 is close to 1. Also, we are doing an interpolation of data.
Hypothesis Testing Question: 2018 Paper 2 Question 9
(i) Scatter diagram:
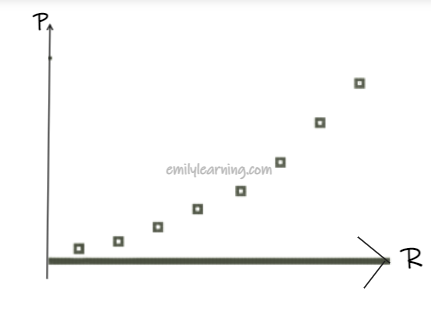
From scatter plot shows that the relationship between P and R is non- linear. Hence, P and R may not be well modelled with the linear equation of P = aR + b
(ii)
For model P = aR + b, r = 0.96929 = 0.970 ( 3 s.f.), b = -1.41857 = -1.42 (3 s.f.), a = 3.78306 = 3.78 ( 3 s.f.)
For model P = aR2+b, r = 0.9930388 = 0.993 ( 3 s.f.), b = -0.282607 = -0.283 ( 3 s.f.), a = 2.84577 x 10 -8 =2.85 x 10⁻⁸
Since P = aR2+b has an r value closer to 1, it is a better model.
(iii) P = (2.84577 x 10 -8)R2 – 0.282607
when P = 0.9, R = 6446.4 = 6450 (3 s.f.)
Estimation is reliable as r is close to 1, and P -= 0.9 is within the data range.
(iv) when R= 3300, P = 0.027297 = 0.0273 ( 3 s.f.)
Estimation is unreliable, as we are doing an extrapolation.
(v) P = 3600[(2.84577 x 10 -8)R2 – 0.282607]
Hypothesis Testing Question: 2019 Paper 2 Question 10
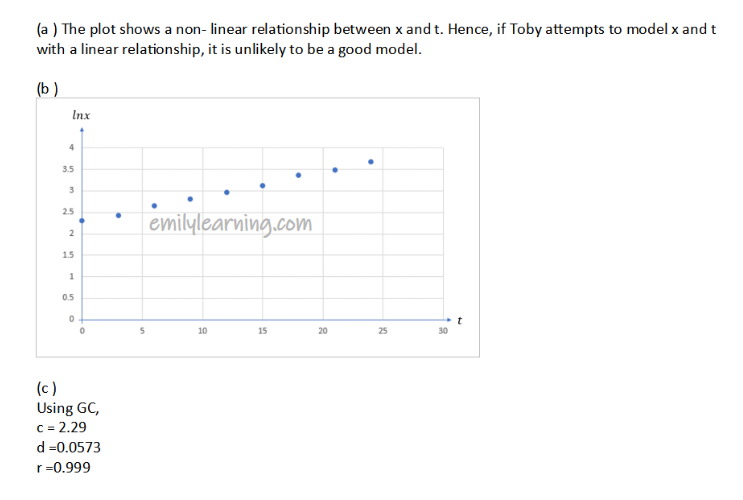
(i) (a) and (b)
(c)
Sum of square of residual = 1.33333 = 1.33 (3 s.f.)
(d)
(i) Square of residual is always positive. Hence the square of residual will not cancel another’s off.
If there are both positive and negative residuals, when we add up the residuals, the negative residuals will cancel off the positive ones, and reduce the absolute value of the sum of the residuals.
(ii) Bhani’s model is a better fit as it has a smaller sum of squares of the residual.
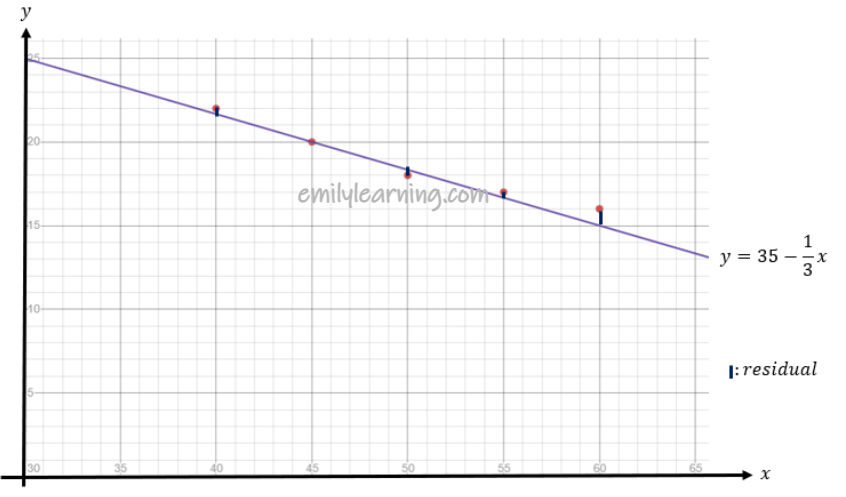
(iii) (50, 18.6)
(iv) Using the graphic calculator, y = -0.3x + 33.6 , r= -0.985
(v) When x= 30, y = -0.3(30)+33.6 = 24.6
Fuel consumption is 24.6 km/litres.
This value is expected to be unreliable. X=30 is outside the data range of x.
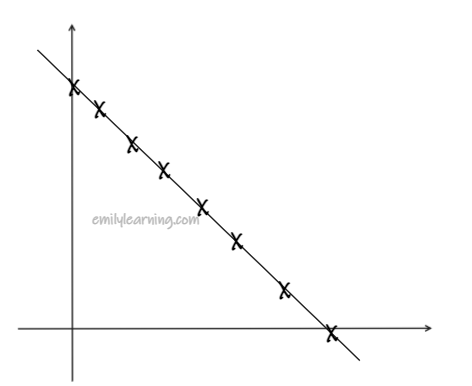
(vi) All the data points lie on the line.
Hypothesis Testing Question: 2020 Paper 2 Question 7
(i)
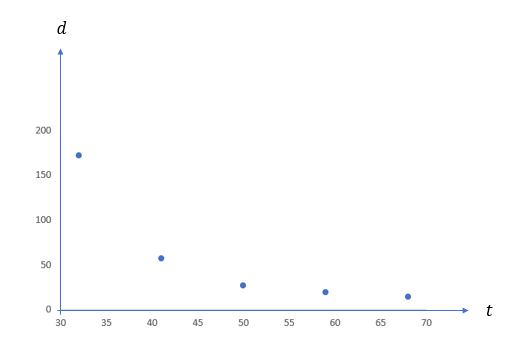
r= -0.848
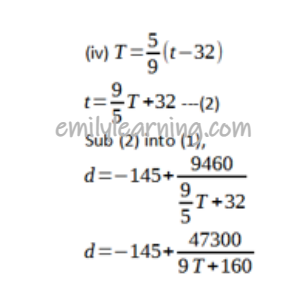
(ii)
By G.C,
-a =-145.125
a =145 (3 s.f)
b= 9456.40
b= 9460 (3 s.f.)
r = 0.941
(iii) Using regression equation,
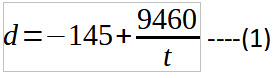
When t =86, d = -35.0 ( 3 s.f.)
Since the study found that t = 86 when d = 32, but Lim’s model gives d = -35.0 when t= 86, Lim’s model does not fit this additional data.
Hypothesis Testing Question: 2021 Paper 2 Question 9
A Complete Course on H2 A Level Math Statistics
Want a complete course on H2 A Level Math Statistics?
Check out our course here, where we cover all the topics tested in statistics.
The course includes concepts, types of questions, and how to apply them, so that you’ll score for your exam.