
The normal distribution is a continuous probability distribution that is symmetric and bell-shaped. It is one of the most widely used probability distributions in statistics. The normal distribution is characterized by its mean (μ) and standard deviation (σ).
For a continuous variable X that follows a normal distribution, and has mean μ and standard deviation, σ, we can define X as:
X ~ N( μ, σ2)
μ: mean
σ: standard deviation
σ2: variance
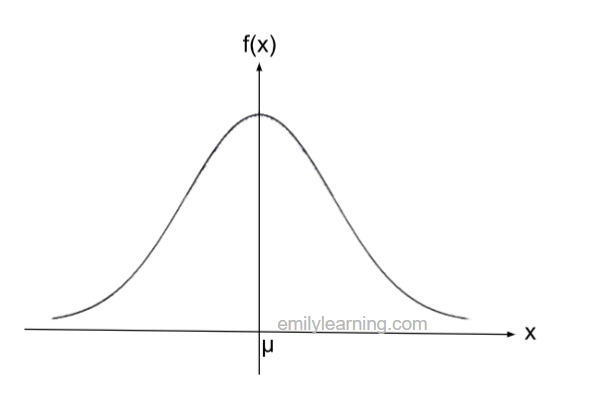
The bell shaped curve of normal distribution is:
Standard Normal, Z
Standard normal, Z, is a normal distribution with a mean of 0 and σ = 1. Z ~N(0, 1).
To convert any normal distribution e.g. X to Z (standard normal), we use this formula: Z = (X -μ)/ σ
We convert a normal distribution to standard normal when μ and/or σ are unknown.
Combining Normal Distributions
If X and Y are independent, with X ~ N( μ1, σ12) and Y ~ N( μ2, σ22)
aX ± bY ~N(aμ1 ± bμ2 , a2σ12 +b2σ22)
If x̄ represents mean of X out of n samples, and X ~ N( μ, σ2),
then x̄ ~ N( μ, σ2/ n)
Central Limit Theorem
If x̄ represents mean of X out of n samples, where n is large, if the distribution of X is unknown, or the distribution is NOT a normal distribution, we can still say x̄ ~ N( μ, σ2/ n), by Central Limit Theorem.
Finding Normal Distribution Using Graphic Calculator Ti84
You’ll use these functions in your graphic calculator (Ti-84):
To find probability, use normcdf.
If you are given P(X<a) = 0.3, and asked to find a, then use invnorm.
How to approach H2 A Level Math Statistics Questions
Want a complete course on normal distribution and the ENTIRE OF H2 A Level Math Statistics?
Check out our course here, where we cover all the topics tested in statistics.
The course includes concepts, types of questions, and how to apply them, so that you’ll score for your exam.